In my last blog, I showed how analysis and simple tuning of the Millennium® chart servers at one site saved nearly 7 hours in print times over the course of a week. I gathered those times from Millennium’s Chart Request Table, which also yields information about the size of the charts sent to each server. You might be surprised at what you can learn from those numbers.
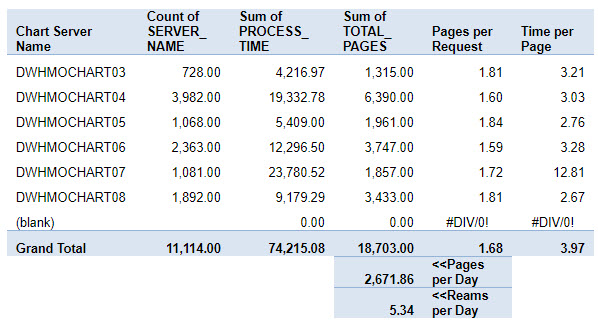
Below is the Excel PivotTable we built from a week’s worth of requests sent to a client’s chart servers.

t’s look at the Total Pages and Pages per Chart Request columns.
Dividing the number in the Grand Total cell for Total Pages by 7 gives you the total number of pages printed through the chart servers in a day. If you take that number and divide it by 500 (the number of sheets in a ream of paper), you get the number of reams of paper you are printing JUST for chart printouts. The site above is printing more than 5 reams of paper a day. I had one client generating more than 7,000 pages—more than 14 reams of paper—every day.
Most sites I work with are astonished to realize the amount of paper they are using. But it helps explain why nursing units and medical record/health information management departments have seen an increase in operational costs as the use of EMRs expands. Toner is used up more rapidly, printers may be pushed beyond their duty cycle (the maximum pages they can print per month and still be in warranty), or the amount of RAM or memory on the printers may have to be increased.
Knowing paper usage patterns for chart prints may be used for planning and acquisition of properly sized printers for both clinical and business areas. At one Millennium site I worked with, I recommended that all printers tied to Millennium have 128 MB of RAM. For Medical Records/Information Management, I recommended a duty cycle of at least 50,000 pages per month. The site represented in the table above is printing more than 80,000 pages per month. This data helps to explain why inkjet printers generally will not work well in a Millennium environment. Neither will printers with paper trays of less than 250 pages.
Prognosis: It is crucial for areas using Millennium chart printing to understand how much they spend in support of Millennium each fiscal year. Using the Chart Request Table to analyze paper usage for chart printing will help organizations look realistically at printer and paper needs…and budget accordingly.
Next: Tuning Oracle database tables to improve chart server performance.