

Our last entry on Millennium® performance issues for RHOs (remote-hosted organizations) walked you through the necessary steps for evaluating queuing in Millennium’s Open Engine FSI/ESO (OEN). This week we will cover another area where queuing or waits can be a problem: Oracle tuning. Oracle is the database where all of the clinical and financial information for Millennium is kept. When Oracle is slow, everything in Millennium is slow.
Tuning Oracle has two major areas of analysis: scripts and the kernel. Since Rob Dearden and David Fletcher spent several weeks on how to determine which scripts were causing issues, I am going to focus on the kernel. The kernel is the part of Oracle that can be tuned without getting new code or SQL scripts for Millennium. Oracle has an incredible amount of data about itself. If you run the CCL command “rdb select * from v$fixed_view_definition go” against an Oracle 10g database, you will see at least 774 views of data about the database and its performance.
So how do I find out if I’m having a queuing issue with Oracle?
There are a couple of queries you can run from CCL or from SQL*Net to show you some information about how Oracle is tuned. Due to the fact that Cerner is only supporting Oracle 9.2.0.5 on VMS, 10.0.1.4 on HP-UX, and 10.2.0.3 on AIX and Linux, I will focus on what we can see with these versions of Oracle. To find out which version of Oracle you are running, go into CCL and type the following command: “rdb select * from v$version go”. The results will look something like this:
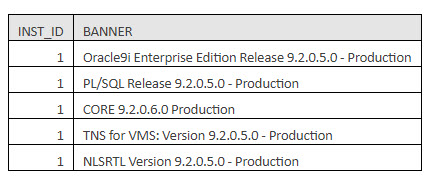
The first row under the heading tells you what Oracle release you are supporting. In this case, it’s the 9.2.0.5 client.
Next, you want to get a high-level view of where you are waiting. Since there can be up to 16 database instances running in support of Millennium 2007.18, you will use the gv$ commands. These commands run against all Oracle instances that are working as a cluster, unlike the v$ commands, which only show the information from the Oracle instance you are currently connected to. From CCL, run the following command: “rdb select * from gv$system_event order by time_waited_micro desc go”. The first 10 values will look something like the table below.
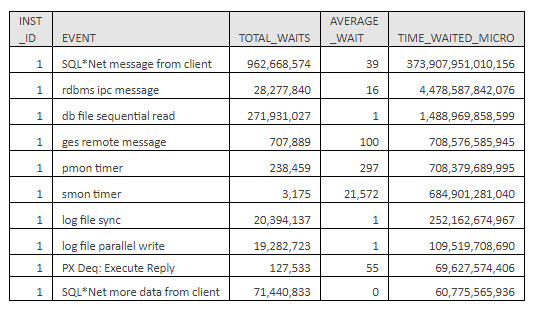
For readability, I took the liberty to add commas to the values over 1,000, and for space issues, I squished headings and removed two columns. Still, you can see that by far the No. 1 wait for Millennium RAC (Oracle clusters) is SQL*Net message from client. This measures the time that elapsed from the moment Oracle gave the data to the host’s TCP/IP stack until the client — in this case, Millennium Application servers — returned a response.
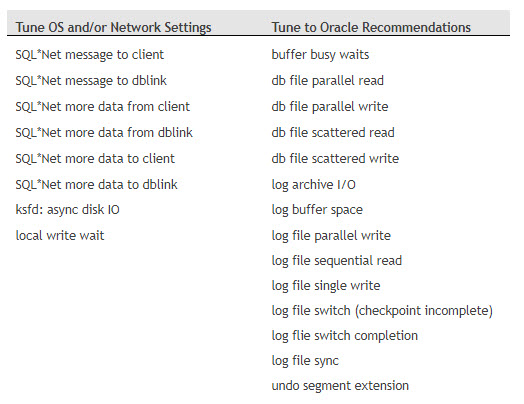
Here is a little quandary. This delay cannot be improved by tuning Oracle. Instead, you have to tune the TCP/IP stacks and operating systems where the database and Millennium Application servers reside. For a complete list of the events and their classifications that are considered null and not tunable by Oracle, please see the attached Oracle Waits table.
The two categories that are tunable include 1) the operating system (OS) and network tuning and 2) Oracle init.ora or spfile tuning. Below is a list of the waits frequently seen with Millennium and which category they fall into.
Another Oracle table that is incredibly useful when you are in RAC (Cache Fusion) configuration — meaning you have two or more Oracle instances running — is Resource Limit. This table shows you the Oracle resources each Oracle instance is consuming. To access the data, execute the following command from CCL: “rdb select * from gv$resource_limit go”. The key columns are Max Utilization and Initial Allocation. The rows where Max Utilization is larger than the Initial Allocation indicate performance issues. The slowdown occurs because the additional memory has to be allocated from the shared pool. The solution is to increase the Initial Allocation to equal the Max Utilization. That way, the memory is allocated at Oracle startup instead of when clinicians or back-office people are using Millennium.
If you have Oracle 10g or higher, another useful tool is the DBA Alert History. This table shows a database administrator (DBA) the performance, space or other capacity issues occurring within the database. To access this table, execute the following command from CCL: “rdb select * from dba_alert_history go”. The Reason and Suggested Action columns are the two you want to pay attention to. Reason shows you what went wrong; for instance, “Tablespace [UNDO] is [44 percent] full.” This means the UNDO segment needs to be increased. The Suggested Action column in this case would say, “Add space to the tablespace”. A third column that can be useful for categorizing these events is Message Group. In the example, this was a Space Message Group. The information in the DBA Alert History table provides you with an almost natural English view of issues in your database. It is an excellent starting point for easily tracking consistent Oracle issues.
What do I do if I’m having queuing issues?
If you discover Oracle queuing issues, you will have to work with your production DBA to discuss how to correct them. Use tact when talking with the DBA. Even though the truth is in the data, I have found that many DBAs grow defensive when they’re shown the data and can be reticent to make any changes. If they don’t seem to like my approach to data collecting, they can use one of the methodologies published by Oracle for maximizing throughput. Links to two are listed below. My experience has been that when Oracle is properly tuned, many hours of waiting can be eliminated from the Millennium environment.
http://www.oracle.com/technology/deploy/availability/htdocs/maa.htm
http://www.oracle.com/technology/documentation/database10gr2.html
Prognosis: Monitoring Oracle waits and taking action to reduce or eliminate them will reduce the time it takes for Millennium applications to update and retrieve information. This saves time and frustration for the clinicians and improves care for the patients.
Next week: Application and database capacity issues and where to look to see if you are having throughput issues.