

The little-known Chart Request Table contains key information about the performance of Millennium chart servers. By accessing the table and exporting it into a spreadsheet, you can create a pivot table that shows the size of the charts being sent to each chart server and how quickly the servers are processing them.
To access a list of the chart servers that took work in the previous 7 days, run the following SQL query:
select server_name, process_time, total_pages from chart_request where request_dt_tm > (sysdate -7)
What exactly are you asking for?
- Server Name refers to the chart server that generated a chart. The Chart Request Table will list each chart job or chart print event in a separate row.
- Process Time is the time in seconds that the chart creation took.
- Total Pages is the total number of pages created per chart job or chart print event. It is always listed as a whole number.
To make sense of all the data, you need to export it to a spreadsheet and create a pivot table that summarizes the information into a usable form. Below is a Microsoft Excel 2007 PivotTable created with de-identified client data.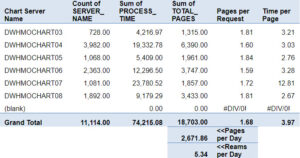
Creation of the Excel PivotTable can be confusing. Here’s how to do it:
From the Excel spreadsheet listing the chart server data, access PivotTable by selecting the Insert tab at the top of the screen and then the PivotTable icon on the far left. The PivotTable screen will list your data fields on the top right with four options below for how to place them in the table.
- Drag the field named Server Name into the Row Labels area.
- Drag the field named Server Name into the Values area.
- Drag the field named Process Time into the Values area.
- Drag the field named Total Pages into the Values area.
- Verify that the Server Name in Values is a count, not a sum.
- Verify that the Process Time is a sum, not a count.
- Verify that the Total Pages is a sum, not a count.
The blank row at the bottom of the table is there because when the data was retrieved from Oracle, some active chart jobs had not completed. I left the data in the spreadsheet for completeness, but you can filter the Server Name in the Row Labels to exclude blanks from the spreadsheet.
Next, you need to create the last two columns of the Excel PivotTable.
- To create the column header Pages per Chart Request, take Total Pages divided by Count of Server Name and copy that formula down to the Grand Total line.
- To create the column header Time per Page, take Process Time divided by Total Pages and copy that formula down to the Grand Total line.
These last two steps will show you how many pages are being printed (a topic I’ll address in the next blog) and how many seconds it takes to process each page sent to the chart server.
Now we can examine the numbers. The chart server DWHMOCHART08 has the fastest time of 2.67 seconds per page. The slowest chart server is DWHMOCHART07 at 12.81 seconds per page. The fastest chart printer is nearly five times faster than the slowest. If all of the chart jobs printed at the fastest rate, clinicians would spend 6.72 fewer hours in the week waiting for the paper they need to treat their patients. In the course of a year, that savings adds up to more than 14 days.
Tuning of the chart servers would likely take a skilled member of your IT team about half a day to complete. It is done by 1) taking an image (disk copy) of the fastest chart server, which gives you its operating system configuration, and 2) reimaging the other chart servers with the disk copy of the fast one.
For even faster processing, you can go a few steps further: 1) Make certain the log level on each chart server is 2 or lower, 2) defragment the hard drive on the chart servers every night, and 3) do normal tuning of the Windows operating system (another topic I’ll address in the coming weeks). These changes would likely lower your process time to 1 second or less per page, saving clinicians at least 15 hours over 7 days or more than 33 days in a year.