

The Millennium® subsystem called Discern EKS allows users to set up rules in which special events automatically trigger other events. To determine if you’re having issues with a rule or set of rules, we’ll look at the Oracle table EKS_MODULE_AUDIT. This table shows when rules are triggered, how long they take to fire, which EKS server was used, the rule’s request number and more. If you run a lot of rules – I was on a site recently that triggered almost 4 million a day – the table will take a while to run, even if you’re only looking at a single day.
A second table, the Request table also contains useful information, although we will not cover that table here. It contains all of the Request numbers, their descriptions, the request names and request class routing.
To access the EKS_MODULE_AUDIT table, run the following command from CCL:
CCL> RDB SELECT SERVER_CLASS, REQUEST_NUMBER, MODULE_NAME, BEGIN_DT_TM, END_DT_TM, UPDT_DT_TM FROM EKS_MODULE_AUDIT WHERE BEGIN_DT_TM > (SYSDATE – 1) GO.
This will create a spreadsheet that looks something like the following:
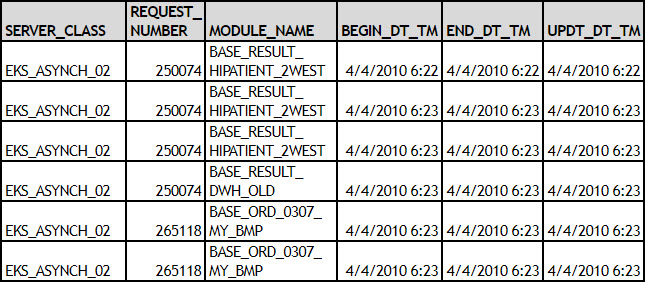
This data can then be put into Excel (2007 or greater) to create a PivotTable with the information, which we will examine from several perspectives. First, create a Duration column by subtracting END_DT_TM from BEGIN_DT_TM. To create the PivotTable, click the Insert tab in Excel and then click PivotTable. To build your table:
- Put Request_Number as the first item in the Row Labels section, with Server_Class below Request_Number in the Row Labels.
- Put a Count of Request_Number in the Values section. In the Value Field Settings, change the “Show Value as” field to “% of Column.”
- The third line in place is “Duration,” and it will change to “Sum of Duration.”
- The fourth line in place in the Values section is “% of Duration.” In the Value Field Settings, change the “Show Value as” field to “% of Column.”
Following these steps will produce a Duration Percentage table similar to the one below, in which you can see which requests took the most time.
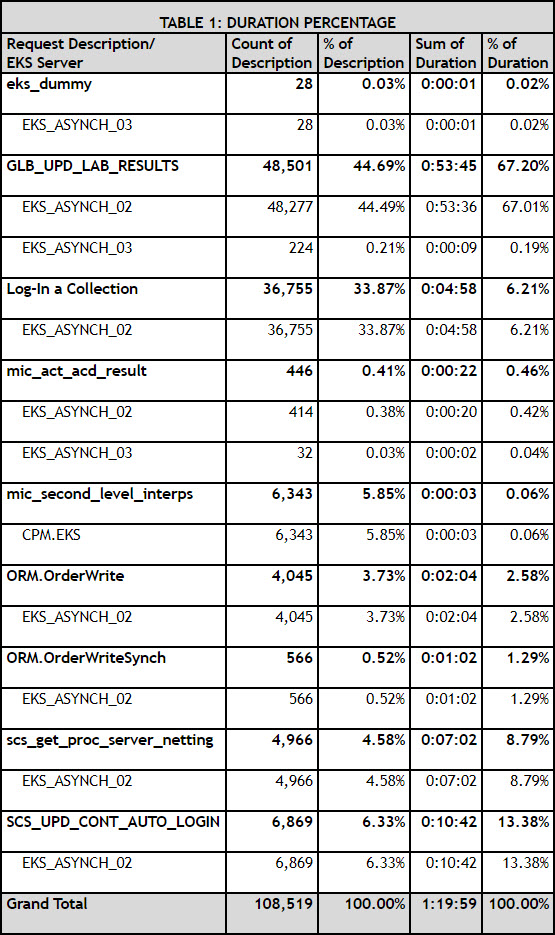
- The Request named GLB_UPD_LAB_RESULTS comprised 44.69% of the EKS rules triggered in the prior 24 hours. It also took 67.20% of the time the EKS rules took to fire. Contrast that result to Log-In a Collection, which triggered 33.87% of the rules but only took 6.21% of the time. Because you want to lessen the impact on EKS capacity, this information should elicit two responses for the GLB_UPD_LAB_RESULTS request:
- To improve performance in the short run, go back and get all of the rules to fire on EKS_ASYNCH_03 to spread the load that EKS_ASYNCH_02 is doing. You will need to add additional EKS_ASYNCH_03 server instances, but the switch will provide a much more balanced workload between these two services.
- To address the core problem, evaluate why the request is being triggered this number of times and if the rule is placed appropriately in the workflow; then rewrite the rule, if necessary.
A second way to evaluate the EKS rules is to look at the number of times a rule or module took less than 1 second, 1 second, 2 seconds, etc., to run. The Duration Breakout table below is sorted first by the rules taking greater than 5 seconds (>0:00:05) with a secondary sort on the rules taking 1 second (0:00:01). If the rule never took more than 5 seconds, it was not evaluated for tuning.
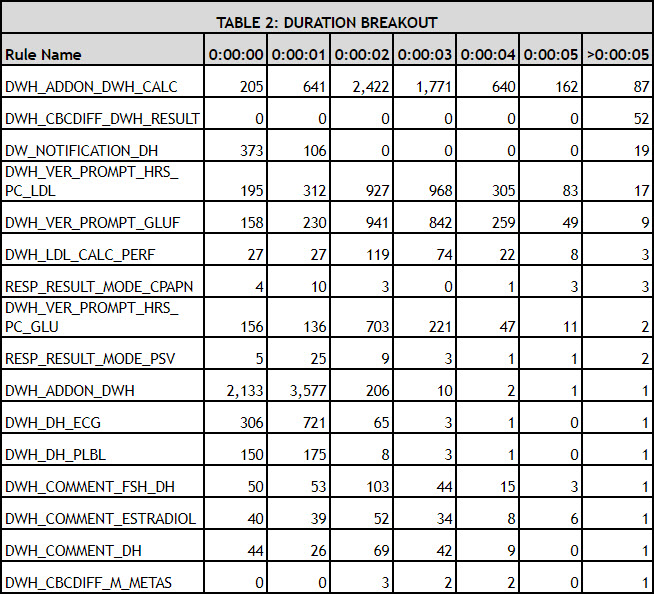
From this information, we can see that the DWH_ADDON_DWH_CALC rule had 87 times where it took over 5 seconds to run. Those 87 times represent a total of 9 minutes, 23 seconds, but that’s only a part of the story. The rules that took from 0:00:00 to 0:00:05 seconds to fire add up to 3 hours, 56 minutes. In the second rule on the list, all the rules took longer than 5 seconds to run, but the total time was only 11 minutes, 7 seconds. The results show that:
- Rules taking greater than 5 seconds to run do have an impact and should be tuned for performance.
- Rules that run fast but are triggered many times throughout the day can have an even more dramatic impact on EKS capacity.
We can extrapolate this same data in yet another way to gain a slightly different perspective. We’ll count the total times a rule was triggered, sum the total time each rule took to fire and then calculate the % Total Executions (triggered rules), % Total Duration and Average Duration. Sorting by the % Total Duration (descending), your resulting Total Duration table will look something like the one below:
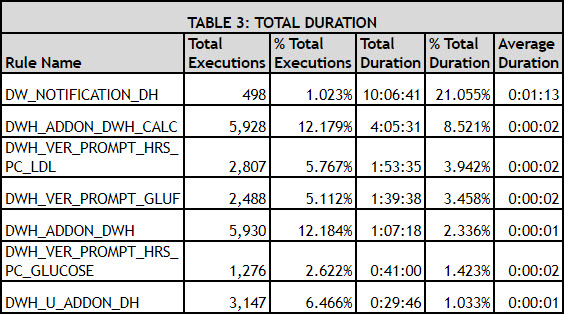
This sort produces different results from the previous one. Rule 1 in the Breakout table became Rule 2 in the Total Duration table, and Rule 3 in the Breakout table became the No. 1 rule in the Total Duration table. Clearly, breaking down each rule into the number of times it triggered and how long each trigger ran (Table 2) did not provide an accurate view of the total impact a rule had on the system. Using the data from both tables 2 and 3, we see how critical the 19 spikes of the DW_NOTIFICATION_DH rule are to the system. Tuning to reduce those spikes would save more than 10 hours of running time for the EKS system in a single day.
Each of these methods for evaluating the performance and capacity of the Millennium EKS subsystem has merit and can be used to create an action plan to benefit the clinicians and technical staff using and supporting Millennium.